


The U.S. economy grew at a 2.7% inflation-adjusted rate, as measured by Gross Domestic Product (GDP), through the end of 2025 (https://fred.stlouisfed.org/graph/?graph_id=473094&rn=789). Real-time weekly indicators as given by various regional Federal Reserve Banks—including Dallas, Atlanta, and New York—suggest the economy largely remains on a similar growth trajectory as of this report.
For long-term investors, understanding economic growth provides insight into how well businesses are performing from both a sales and earnings perspective. As companies expand, they generally become more valuable over time, and market prices often adjust to reflect that value. At present, corporate fundamentals appear favorable. Companies in the S&P 500 are on track for meaningful profit growth, with analysts forecasting earnings growth of approximately 24% for full-year 2026, followed by a 17% increase in earnings and 8% revenue growth in 2027 (https://advantage.factset.com/hubfs/Website/Resources%20Section/Research%20Desk/Earnings%20Insight/EarningsInsight_071026.pdf).
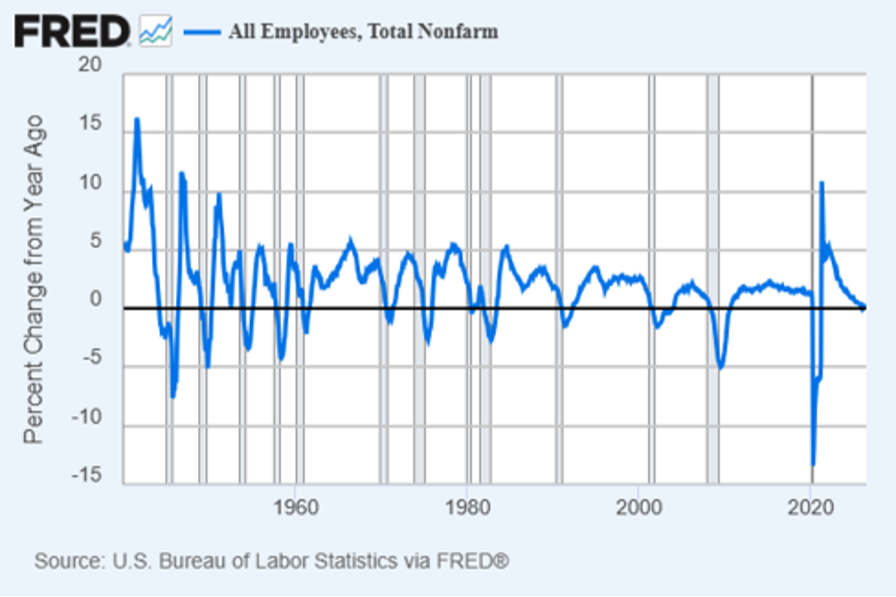
While the backdrop for economic activity and corporate earnings remains constructive, it makes sense to look for potentially problematic areas. One such area may be employment. Job growth over the past 12 months has generally been flat, a condition that has historically been associated with slower economic growth. Thus far, however, 2026 appears to be an exception.
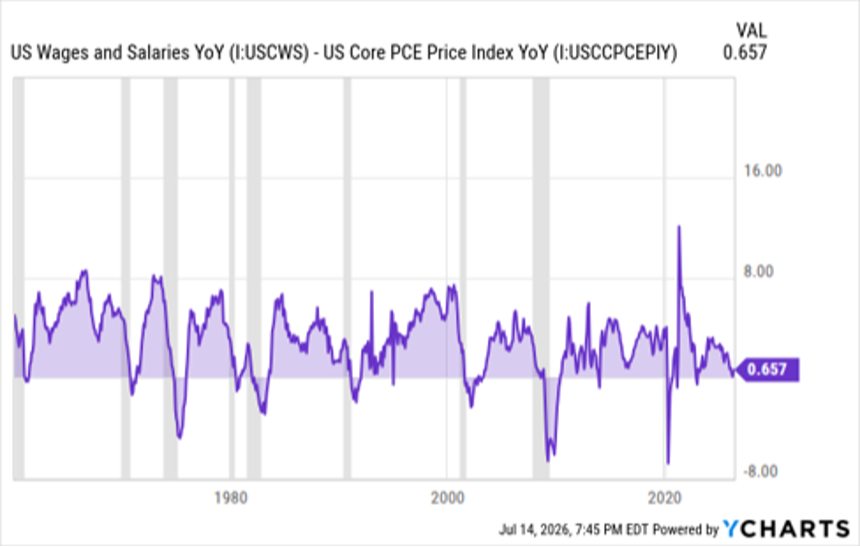
Similarly, inflation-adjusted wage growth has remained relatively modest, another indicator that has often coincided with weaker economic periods. Yet, as with employment, it appears to be an exception so far in 2026.
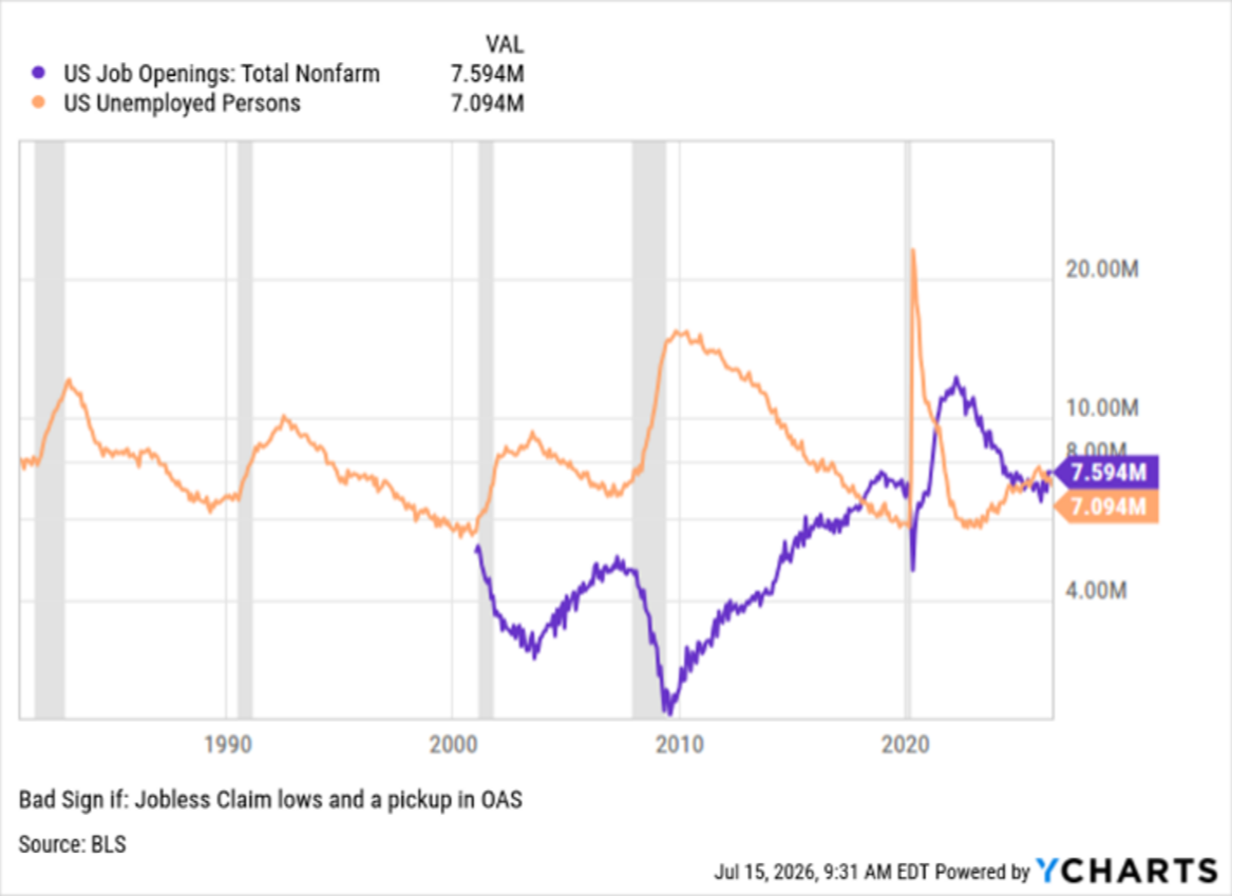
Although portions of the labor market have shown signs of softness, both the economy and corporate sector continue to grow. In our view, this resilience may reflect a combination of substantial business investment related to the artificial intelligence buildout (https://www.stlouisfed.org/on-the-economy/2026/jan/tracking-ai-contribution-gdp-growth) and continued consumer spending supported by older Americans (https://www.aarp.org/money/personal-finance/longevity-economy-report-2026/). At the same time, other labor market indicators remain encouraging. For example, the number of job openings in the U.S. continues to exceed the total number of unemployed individuals.
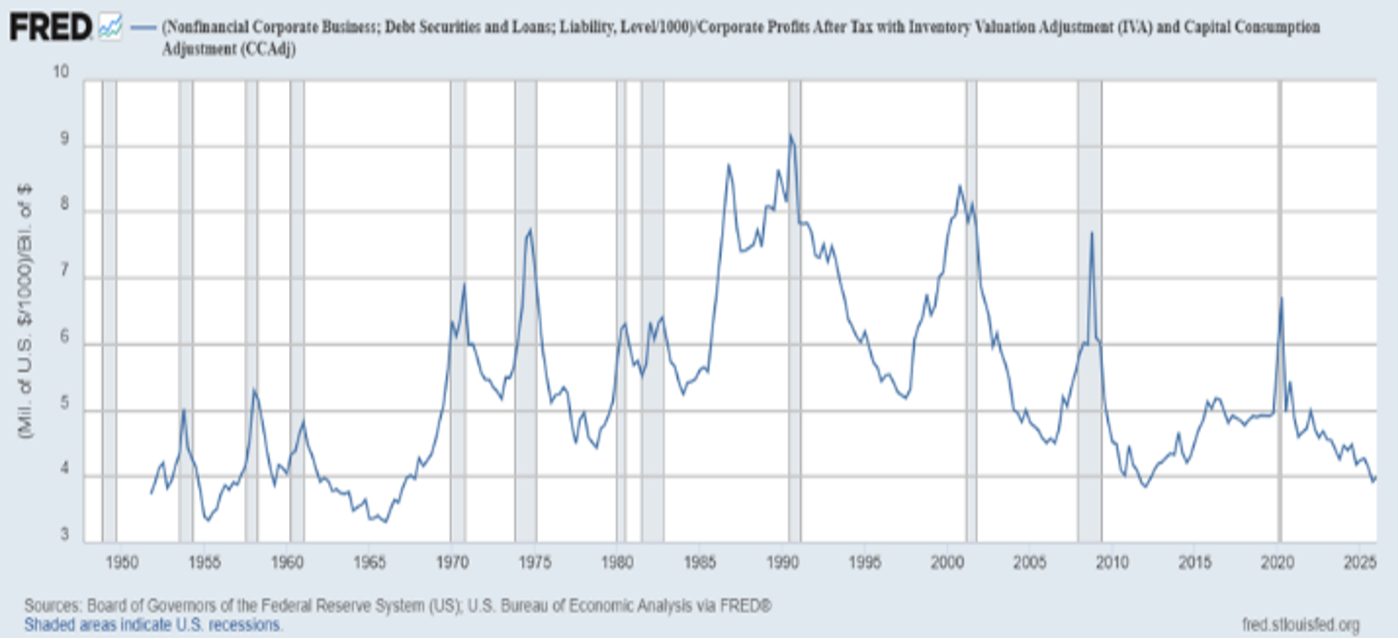
Turning to corporate balance sheets, we consider the financial health of businesses. The following chart illustrates the corporate sector's leverage ratio, measuring outstanding nonfinancial corporate debt securities and loans relative to after-tax corporate profits. Historically, the economy tends to slip into recession after periods of rising leverage as debt has grown faster than profits. Currently, however, the ratio continues to decline, indicating profit growth is outpacing debt growth. Although concerns surrounding private debt have increased in recently, we believe the broader level of corporate debt currently presents a relatively low risk to the overall economy.
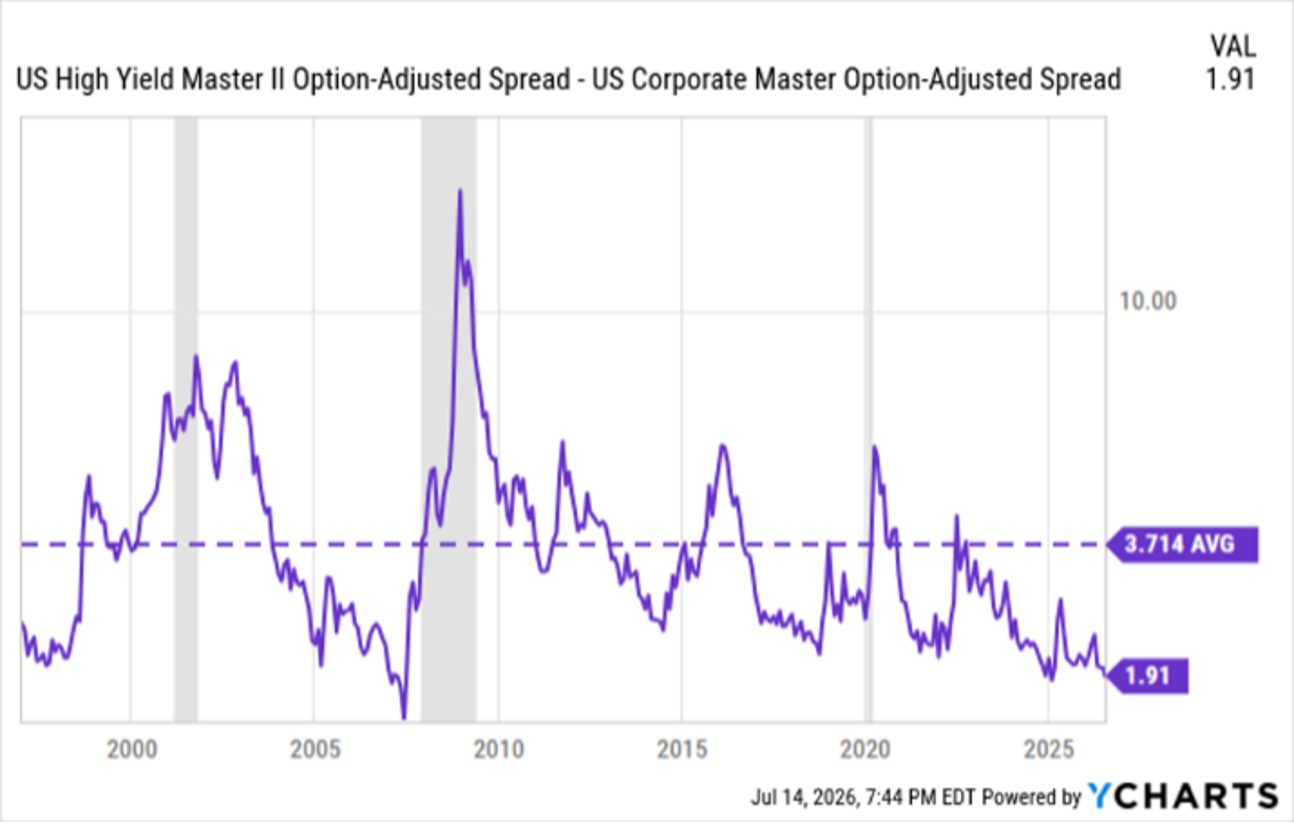
The traditional corporate bond market appears consistent with this assessment. Specifically, the additional yield investors receive for buying high-yield ("junk") bonds instead of investment-grade (stronger credit quality) bonds remains relatively low. Wider credit spreads generally indicate investors are demanding greater compensation for assuming additional credit risk, reflecting higher perceived default risk. At present, relatively narrow spreads suggest bond investors remain less concerned about widespread corporate defaults.
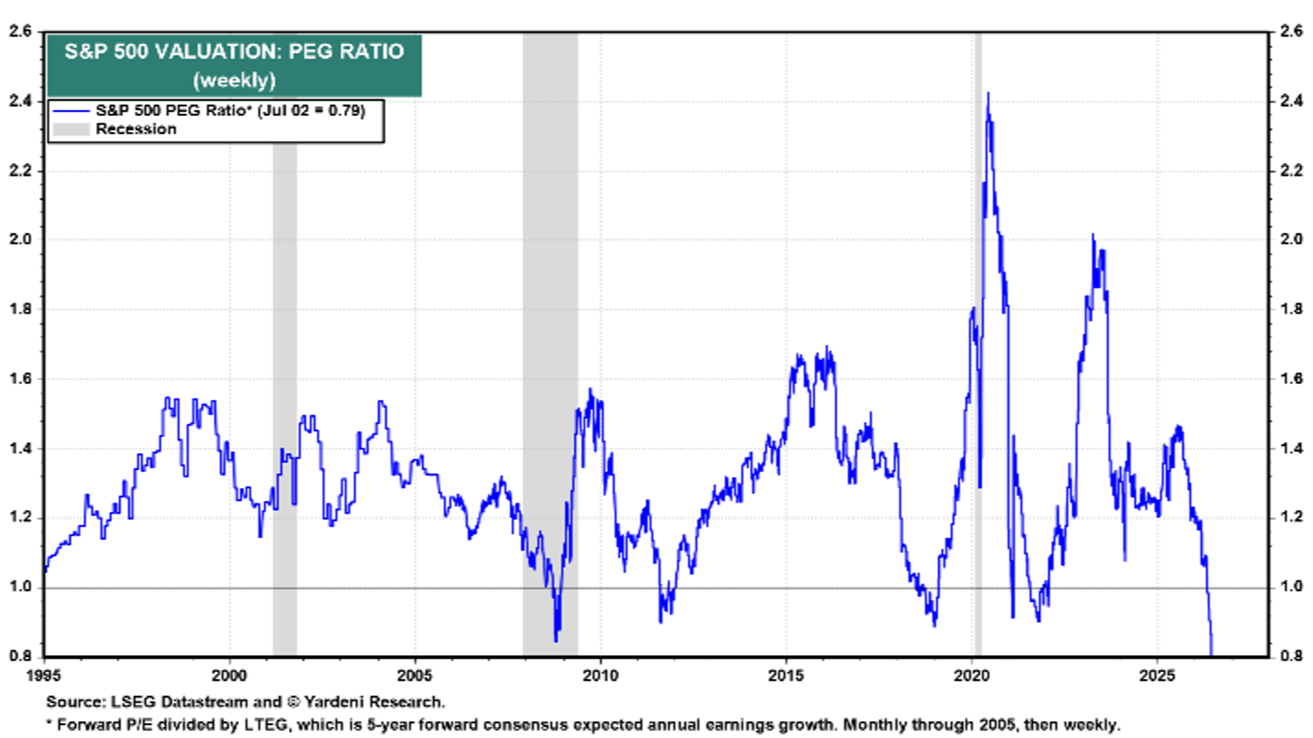
Our final chart tracks the Price/Earnings-to-Growth (PEG) ratio for the S&P 500 from 1995 through mid-2026, providing a measure of valuation relative to expected earnings growth. The PEG ratio is calculated by dividing the index's forward price-to-earnings (P/E) ratio by the long-term earnings growth (LTEG) rate expected for companies within the index. For much of the past three decades, the S&P 500's PEG ratio has remained above 1.0. In 2026, however, the ratio declined sharply to approximately 0.8, suggesting the consensus expectations for five-year annual earnings growth have increased compared to the P/E ratio, making the index appear historically inexpensive relative to its projected growth outlook.
To be sure, there are other statistics that suggest the equity market is not inexpensive. However, in our view, the overall market appears reasonably valued, with meaningful evidence supporting continued earnings growth. While future market performance cannot be guaranteed and forecasts are inherently uncertain, we remain constructive on the market for the balance of 2026 and continue to believe investors are best served by maintaining their long-term strategic asset allocations.
----
Aviance Capital Partners, LLC (“ACP”) is an SEC registered investment adviser located in Naples, Florida. Registration as an investment adviser is not an endorsement by securities regulators and does not imply that ACP has attained a certain level of skill, training, or ability. While information presented is believed to be factual and up-to-date, ACP does not guarantee its accuracy and it should not be regarded as a complete analysis of the subjects discussed. All expressions of opinion reflect the judgment of the authors as of the date of publication and are subject to change. Not all services will be appropriate or necessary for all clients, and the potential value and benefit of the ACP’s services will vary based upon the client’s individual investment, financial, and tax circumstances. The effectiveness and potential success of a tax strategy, investment strategy, and financial plan depends on a variety of factors, including but not limited to the manner and timing of implementation, coordination with the client and the client’s other engaged professionals, and market conditions. This should not be construed as specific investment, financial planning or tax advice tailored to an individual reader. ACP suggests that readers consult a financial professional, attorney or tax advisory professional about their specific financial, legal or tax situation. Past performance does not guarantee future results. All investment strategies have the potential for profit or loss, and different investments and types of investments involve varying degrees of risk. There can be no assurance that the future performance of any specific investment or investment strategy, including those undertaken or recommended by ACP, will be profitable or equal any historical performance level. The index and sector performance data appearing or referenced above has been compiled by the respective copyright holders, trademark holders, or publication/distribution right owners.
Additional information about ACP, including its Form ADV Part 2A describing its services, fees, and applicable conflicts of interest and its Form CRS is available upon request and at https://adviserinfo.sec.gov/firm/summary/146597. For current ACP clients, please advise us promptly in writing, if there are ever any changes in your financial situation or investment objectives, if you wish to impose any reasonable restrictions to our management of your account, or if you have not been receiving at least quarterly account statements from your account custodian.