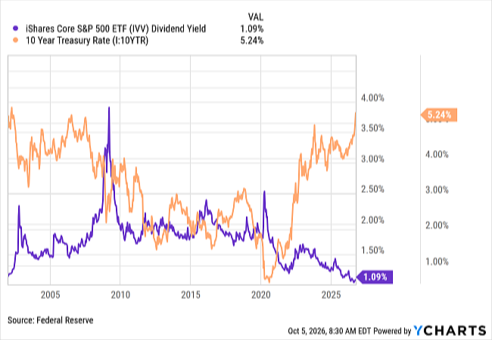
The spread between the 10-Year Treasury yield (currently at 5.30%) and the S&P 500 dividend yield (1.09%, as measured by the iShares Core S&P 500 ETF) serves as a key indicator of relative value between equities and fixed income. When dividend yields outpace bond yields, stocks hold a clear income advantage; conversely, higher bond yields tilt the incentive toward fixed income. Today, that income advantage for bonds stands at its highest level since 2002.
Historically, while equities offer stronger long-term price appreciation potential, bonds provide lower downside risk. When investors turn risk-averse—such as when recession fears mount—this combination of a significant income advantage and capital preservation in bonds can put downward pressure on stock valuations.
However, current economic drivers remain on solid footing, supported by full employment, steady earnings growth, and resilient consumer spending. Consequently, while this historically wide yield gap warrants close attention, it is not currently amplified by a weakening economic backdrop.
. . .
U.S. equities delivered mixed results last week as investors weighed encouraging inflation data against continued pressure from elevated Treasury yields. While September's employment report attracted significant attention, the broader message from the week's economic releases was largely encouraging. Inflation continued to moderate, economic growth remained durable, and corporate profitability stayed healthy. As a result, investors spent much of the week evaluating whether higher interest rates signal growing risks for markets or simply reflect an economy that continues to outperform expectations.
Inflation Continued to Move in the Right Direction
Last week's inflation data provided further evidence that price pressures are gradually easing.
The Federal Reserve's preferred inflation measure, the Personal Consumption Expenditures (PCE) Price Index, showed core inflation holding at 3.0% year over year in August.1 While still above the Fed's long-term 2% objective, the reading came in below expectations and continued a broader trend of improvement from the elevated levels experienced earlier in this cycle.
Perhaps more encouraging, shorter-term inflation measures continued to moderate. The three-month annualized rate of core inflation slowed to 2.0%, while the six-month annualized rate declined to 2.7%, suggesting underlying inflation pressures are moving closer to levels consistent with the Fed's target.
Investors also received support from annual revisions to economic data, which showed inflation earlier this year was lower than previously estimated. Taken together, the latest readings suggest progress toward price stability has been somewhat stronger than markets believed only a few months ago.
While inflation remains above the Federal Reserve's comfort zone and policymakers are likely to remain cautious, last week's data reinforced the view that the broader inflation trend continues to move in a favorable direction.
Labor Market Data Suggested Gradual Cooling
The labor market remained a key focus throughout the week, culminating with Friday's closely watched employment report.
Earlier reports presented a mixed but generally stable picture. The JOLTS Job Openings Report showed available positions declined to 7.08 million, suggesting labor demand continues to normalize.2 Meanwhile, the ADP Employment Report showed private employers added 90,000 jobs during September, while initial unemployment claims remained relatively subdued.3
Friday's employment report reinforced the theme of moderation rather than deterioration. Nonfarm payrolls increased by 29,000 jobs during September, below consensus expectations, while prior months were revised lower by a combined 60,000 jobs. The unemployment rate edged higher to 4.2%, and wage growth slowed to 3.0% year over year.4
Although the headline figures reflected a slower pace of hiring, the broader labor market continues to appear relatively stable. That helped reduce concerns that stronger labor-market conditions would compel the Federal Reserve to raise rates again in the near term, leading markets to modestly scale back expectations for an October rate hike.
Economic Growth Remained Durable
Alongside improving inflation data, several reports suggested the economy continues to operate from a position of underlying strength.
Second-quarter GDP growth was revised higher to 2.2%, supported by stronger consumer spending, business investment, and private domestic demand than previously reported.5 Consumer spending remained healthy through August, highlighting the ongoing importance of household demand as a driver of economic growth.
Manufacturing activity also continued to improve. The ISM Manufacturing Index remained firmly in expansion territory during September, providing additional evidence that a sector that struggled through much of the past two years is regaining momentum.6
Corporate earnings expectations have also remained supportive, aided in part by continued investment tied to artificial intelligence and other long-term growth initiatives. Healthy profit growth has helped offset some of the valuation pressure created by higher interest rates.
This combination of healthy consumer spending, improving manufacturing activity, and solid corporate earnings helps explain why economic growth has remained surprisingly resilient despite elevated borrowing costs.
Our Perspective
Despite encouraging inflation trends and softer labor-market data, Treasury yields remained a focal point for investors.
The 10-year Treasury yield briefly moved above 5.3% during the week, reaching its highest level since the early 2000s. Although yields initially declined following Friday's jobs report, much of that move later reversed as investors continued to focus on the broader economic outlook.
Importantly, the rise in yields does not appear to be driven solely by concerns about inflation. Investors are also increasingly pricing in the possibility that economic growth remains stronger for longer, even amid elevated borrowing costs. In that sense, a portion of the recent increase in yields may reflect confidence in the economy's durability rather than concern about imminent economic weakness.
This distinction matters because higher interest rates are not inherently negative for equities. While rising yields can create valuation headwinds and contribute to market volatility, history suggests stocks have often remained resilient when higher rates are accompanied by steady economic growth and rising corporate profits.
The recent environment reflects that tension. Higher yields have created challenges for financial markets, but they are occurring alongside an economy that continues to expand, consumers who continue to spend, and businesses that continue to generate healthy profits.
Our Perspective
Last week's economic data largely reinforced the soft-landing narrative that has supported markets for much of this year. Inflation continued to improve, labor-market conditions showed signs of gradual normalization, and broader economic activity remained firmer than many investors expected entering 2026.
While uncertainties remain, including elevated interest rates, geopolitical tensions, and the possibility of additional policy tightening, the combination of moderating inflation, steady economic growth, healthy corporate profitability, and a gradually cooling labor market remains broadly supportive for equities.
As we move deeper into the fourth quarter, we remain focused on inflation trends, labor-market developments, Treasury yields, corporate earnings, and Federal Reserve policy.
[1] Personal Income and Outlays, August 2026 | U.S. Bureau of Economic Analysis (BEA)