Broker Check
Weekly Update: When PEG's Fly

Weekly Update: When PEG's Fly

June 22, 2026


Weekly Market Update
June 22, 2026
Outlook  

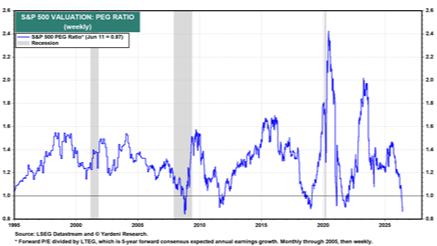
In recent weeks, the S&P 500 Forward PEG ratio (Forward P/E divided by 5-year consensus expected annual earnings growth) has dipped below the 1.0 threshold, as highlighted in data from Yardeni Research. Historically, a PEG ratio below parity suggests that the market may be mispriced relative to its long-term growth prospects. However, the catalyst behind today’s compressed PEG ratio differs from past market cycles. Rather than being driven by undervalued or depressed price-to-earnings (P/E) multiples, the current compression is primarily fueled by highly robust long-term corporate growth estimates.

Because P/E ratios remain elevated by historical standards (see:Yardeni Research), the market's valuation is heavily reliant on corporate America delivering on these aggressive growth projections. As a result, equity markets may exhibit heightened sensitivity to changes in earnings expectations and broader macroeconomic indicators. On the other hand, if the strong growth narratives surrounding structural themes like Artificial Intelligence (AI) materialize and remain on track over the coming quarters, the market is more likely to see sustained upward momentum.

From a risk management and portfolio construction standpoint, our primary focus will both sustainable (in the original sense of the word) growth and reasonable valuations. As always, we maintain a disciplined, data-driven approach to navigate this growth-sensitive environment, balancing structural opportunities with risk monitoring.

. . .

U.S. equity markets experienced a volatile week, ultimately finishing higher as investors digested the Federal Reserve’s latest policy signals alongside mixed economic data. Gains were led by the Nasdaq, supported by continued strength in large-cap technology, while broader indices posted more modest advances following midweek weakness.

Federal Reserve: Hawkish Surprise Drives Volatility

The primary market catalyst was the Federal Reserve’s June policy meeting, the first Fed meeting under the new Fed Chair Kevin Warsh. As widely expected, the Fed held its benchmark interest rate steady at 3.50%–3.75%. However, the tone of the accompanying statement and updated projections was more hawkish than markets had anticipated.

Policymakers removed prior language from the statement suggesting a potential easing bias and revised inflation expectations modestly higher. Importantly, forward guidance signaled a reduced likelihood of near-term rate cuts, while leaving the door open to further tightening should inflation progress stall. This reinforced the view that policy is likely to remain restrictive for longer than previously expected. 

During the press conference, Warsh emphasized that inflation remains above target and that the Committee is prepared to respond if disinflation trends weaken. Markets interpreted this as a clear signal that a policy pivot is not imminent.

Repricing and Stabilization

Financial markets reacted swiftly to the shift in tone. Equity indices sold off following the announcement as investors recalibrated expectations for the path of monetary policy.

In fixed income, short-term Treasury yields moved sharply higher, with the 2-year yield (most sensitive to Fed policy) reflecting a repricing of near-term rate expectations. In contrast, longer-dated yields remained relatively stable, suggesting that long-term growth and inflation expectations remain anchored.

Despite the initial volatility, markets stabilized into the end of the week. A combination of easing pressure on longer-term yields, improving sentiment, and strength in technology helped equities recover and close the week in positive territory.

Economic Data: Resilient but Mixed

Recent economic releases continue to point to a resilient but mixed macroeconomic backdrop, reinforcing the Fed’s cautious stance.
Inflation, while moderating from prior peaks, remains above the Fed’s target.

Areas of persistent price pressures, such as energy-driven increases, still linger and are likely to continue influencing the outlook. At the same time, consumer activity remains solid. Retail sales rose 0.9% in May, highlighting the durability of spending even in a higher interest rate environment.1 Labor market conditions also remain relatively resilient, providing continued support to household income and demand.

Taken together, this combination of sticky inflation and steady growth complicates the policy outlook and limits the Fed’s flexibility to ease policy.

More broadly, other fundamental factors continue to support equity performance. Corporate earnings trends have held up well, and ongoing capital investment in artificial intelligence, automation, and broader technology infrastructure continues to support growth expectations. 

Outlook: Data Dependence and Volatility

Looking ahead, markets are likely to remain sensitive to incoming economic data and evolving Fed communication. Key areas of focus will include the trajectory of inflation, any signs of softening in the labor market, and continued shifts in rate expectations. Periods of volatility are likely to persist, but underlying support from corporate fundamentals and the broader economy should provide support for markets over the longer term.

[1]   Monthly Retail Trade - Sales Report

Market Performance Stats

Upcoming Reports

Monday: Fed Waller Speaks

Tuesday: S&P Global Composite PMI - Manufacturing and Services PMI

Wednesday: Building Permits, New Home Sales

Thursday: PCE Price Index, Gross Domestic Product (GDP)

Friday: Michigan Consumer Sentiment and Expectations

Aviance Capital Partners is a Naples, FL-based registered investment advisor with advisors in Naples and Orlando. We provide professional wealth management, financial planning, and investment strategiessince 2009. Our financial advisors are fiduciaries, offering services such as retirement income planning, tax-efficient investing, and customized portfolio management, all designed to help clients achieve their long-term financial goals.

Whether you're preparing for retirement or seeking a tailored investment management strategy, Aviance’s wealth advisorsin Naples and wealth advisors in Orlando provide financial planning and investment management services to investors in all of Florida and beyond.

Thank you for reading. If you have any questions or concerns, or would like to speak with a member of our team, please click the button below to reach out to us. We would love to hear from you!

 
Aviance Capital Partners
fbintw


Disclosures: Aviance Capital Partners, LLC (“ACP”) is an SEC registered investment adviser located in Naples, Florida. Registration as an investment adviser is not an endorsement by securities regulators and does not imply that ACP has attained a certain level of skill, training, or ability. While information presented is believed to be factual and up-to-date, ACP does not guarantee its accuracy and it should not be regarded as a complete analysis of the subjects discussed. All expressions of opinion reflect the judgment of the authors as of the date of publication and are subject to change. Not all services will be appropriate or necessary for all clients, and the potential value and benefit of the ACP’s services will vary based upon the client’s individual investment, financial, and tax circumstances. The effectiveness and potential success of a tax strategy, investment strategy, and financial plan depends on a variety of factors, including but not limited to the manner and timing of implementation, coordination with the client and the client’s other engaged professionals, and market conditions. This should not be construed as specific investment, financial planning or tax advice tailored to an individual reader. ACP suggests that readers consult a financial professional, attorney or tax advisory professional about their specific financial, legal or tax situation. Past performance does not guarantee future results. All investment strategies have the potential for profit or loss, and different investments and types of investments involve varying degrees of risk. There can be no assurance that the future performance of any specific investment or investment strategy, including those undertaken or recommended by ACP, will be profitable or equal any historical performance level. The index and sector performance data appearing or referenced above has been compiled by the respective copyright holders, trademark holders, or publication/distribution right owners. Historical performance results for investment indexes or sectors represented are for illustrative purposes only and do not represent actual portfolio performance. The indexes or sectors represented generally do not reflect the deduction of transaction and custodial charges, or the deduction of an investment-management fee, which would decrease historical performance results. Investors cannot invest directly in an index. ACP makes no warranty, express or implied, for any decision taken by any party in reliance upon such index information.

The S&P 500 is the Standard & Poor’s index calculated on a total return basis. Widely regarded as the benchmark gauge of the U.S. equities market, this index includes a representative sample of 500 leading companies in leading industries of the U.S. economy. Although the S&P 500 focuses on the large-cap segment of the market, with over 80% coverage of U.S. equities, it also serves as a proxy for the total market. The Dow Jones is a price-weighted market index that tracks 30 large, blue-chip companies. The NASDAQ is the second-largest stock and securities exchange and attracts more technology-focused or growth-oriented companies. The Russell 2000 Index is a small-cap stock market index that makes up the smallest 2,000 stocks in the Russell 3000 Index. The Russell 1000 Index is a subset of the larger Russell 3000 Index and represents the 1,000 top companies by market capitalization. Bond Aggregate is represented by the iShares Core U.S. Aggregate Bond ETF.

All “expectations, forecasts, consensus, or estimates” are based on Bloomberg unless otherwise specified.

Additional information about ACP, including its Form ADV Part 2A describing its services, fees, and applicable conflicts of interest and its Form CRS is available upon request and at https://adviserinfo.sec.gov/firm/summary/146597. For current ACP clients, please advise us promptly in writing, if there are ever any changes in your financial situation or investment objectives, if you wish to impose any reasonable restrictions to our management of your account, or if you have not been receiving at least quarterly account statements from your account custodian.

This material was developed and produced by FMG Suite to provide information on a topic that may be of interest. FMG Suite is not affiliated with the named broker-dealer, state- or SEC-registered investment advisory firm.